


Projects
Explorations
About Me


Contaminant Tracker
A custom-made tool for Quality Control Engineers to predict, analyse and label contaminants for products made at Borealis.
Product Design
Dashboard
R&D
The project
Borealis is one Europe’s biggest providers of polyolefins base chemicals. To maintain the quality of their products, Quality Controllers (QCs) use Contaminant Tracker daily to analyse chemical samples and report defects. As part of a software migration, Borealis wanted to revamp their platform experience to improve learnability, make it easier to use and reduce reporting errors.
My role
As a UX/UI Designer, I worked directly with Quality Control Engineers (QCs) to understand their workflow and major pain points with the old system. We created seven sections, which we tested and validated with QCs and other stakeholders (e.g. Product Owner).
Finally, I created a new component library to ensure visual consistency and worked closely with the development team to review its accurate implementation.
Challenges
Contaminant Tracker was a highly technical, data-intensive system. This means that, in many cases, we needed to find ways to make pages more readable, without removing content. Additionally, beyond understanding users’ pain points and processes, we needed to understand how items (and their data) were related to each other.
Analyses require numerous specifications which was overwhelming for users. Specially without the right visual hierarchy.
The tool used highly specialised language (e.g. SEM Analysis, LIMS, HH-XRF, TCA, cutouts)
There was a lack of visual guidance about steps to follow to complete a task.
Defects can be linked to several studies, and each study may fall into a different category with its own data structure. This made this section very confusing.
Understanding the problem and context
Contaminant Tracker’s Architecture
The platform consisted of 6 sections. The level of access depended on the type of user. We mapped the architecture of the site as it was originally and completed as we got more information through contextual inquires, requirement analysis and testing.
Information Architecture. View in Whimsical.
Customer Journey Map
In some cases, QCs move between mediums (e.g. microscope, computer, access to remote equipment). We wanted to understand what users where trying to achieve throughout their whole workflow, where they were confused or unsure. We did journey maps for different experiences, like reviewing defects, materials, making requests, etc…
Customer Journey Map. View in Whimsical.
Heuristic Evaluation and Contextual Inquiries
I conducted a heuristic evaluation of the site to identify issues such as items with unclear states, or cases were users cannot recover from an error.
Some findings included:
Visibility of system status and recognition:
Across the platform, multiple labels were not self explanatory. Users had to review documentation or memorise meaning.

Error prevention:
Forms allowed to freely input values where only predefined options should be selected.
Recognition rather than recall:
In many cases, the interactions between UI components were unclear. For instance, how a checkbox changed a button’s action.

After that, I conducted Contextual Inquiries with QCs to observe how they went about reporting analyses results.
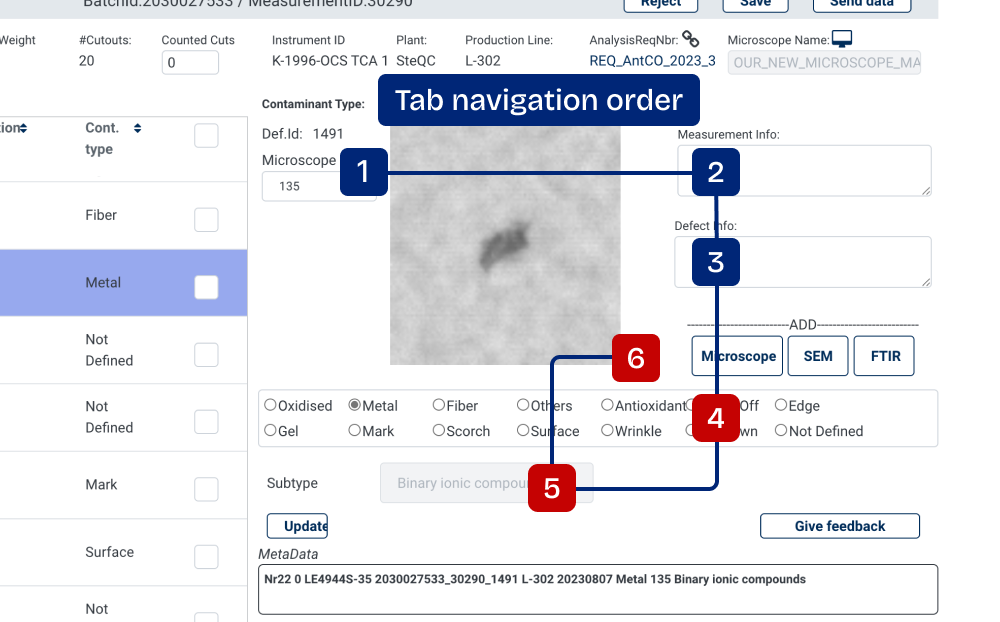
Inaccessible items:
QCs frequently use the system solely with their keyboard as they use one hand to operate their computer and the other one to manipulate a microscope. However, not every section was reachable using the tab button and the lack of order meant that “tab” navigation was inconsistent.
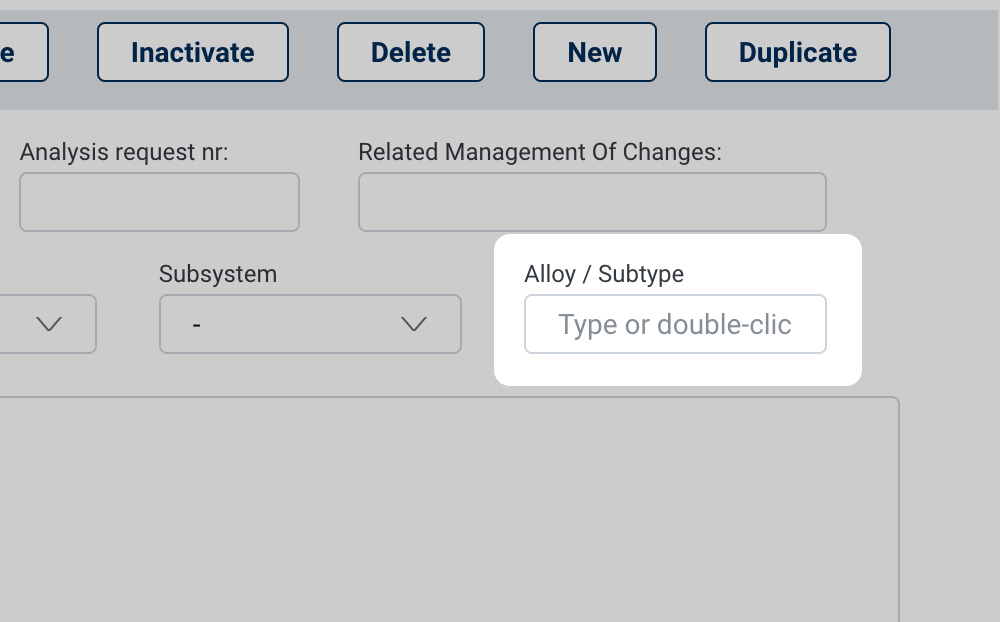
Hidden buttons:
Some buttons were almost hidden and their functionality unclear.

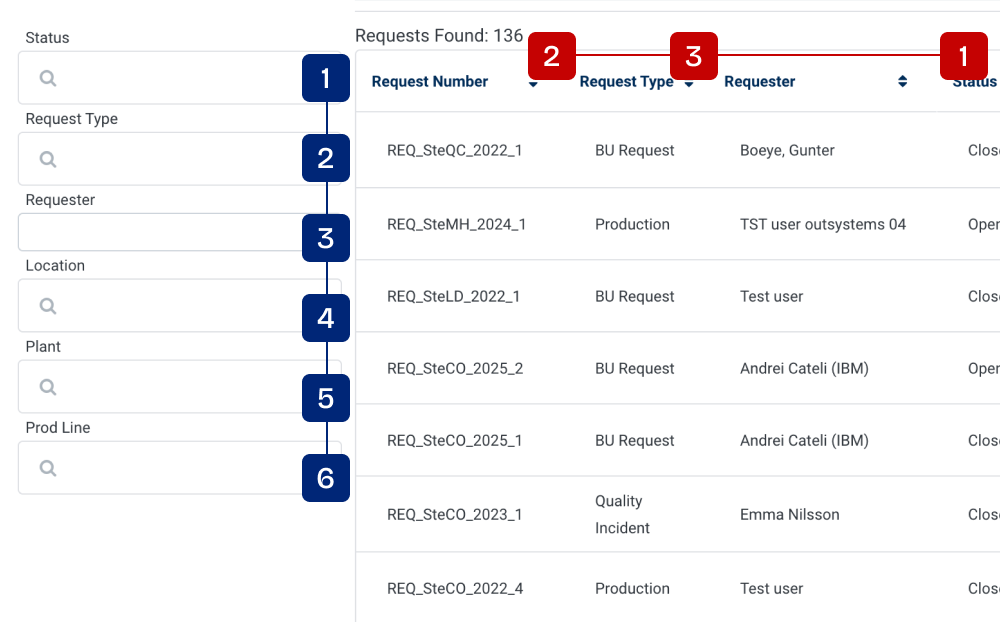
Information Sequence:
The order in which information was presented in tables, did not match how users read and filtered data.
Business needs (and requests)
Initial requirements were provided by the Product Owner, but required further definition from a UX perspective. I translated these needs into concrete UX behaviors and visual components, and by determining how to integrate them into the interface without increasing cognitive load.
As a QC, I want data input to match the output from SEM/XRF so I know how to properly entry the data
As a QC, I want to add new HH-XRF analyses to a batch so I can complete a report
As an admin, I wan to be able to re-open requests that I deemed incomplete so QCs can work on them again.
Wireframes and Testing
We had frequent contact with QCs- That allowed us to ran tests whenever we did major changes to the system’s navigation or how data was presented. We alternated between junior and senior QCs to complete tasks they already did in the legacy system but using the revamped version.
Sample Task:
Your supervisor has confirmed that they recently did a study with a Microscope J2001. This study is related to the Batch ID REQ_SteCO_2025_2.
Assign the study with the appropiate information to the correct Batch ID.
Revamped Designs
Here are some details on the what and why of some of the changes we did.
Batch Detailed View
- Explicit copy: Added labels, changed language and visual treatment to make clear what components do.
- In-context help: Tooltips for technical concepts to reduce the time QCs, specially new ones, spend reviewing documentation.
- Easy to follow layout: Re-designed the screen layout to clearly distinguish between UI areas (Batch ID Details, Defects List, Defect Details), and clarify the steps to follow to complete a task and improve navigation.
- Progressive disclosure: Added navigation tabs for advanced features (such as ”Add SEM analysis") to be showed only as the user needs them, to improve usability and reduce cognitive load.

2
1
4
3
3
3
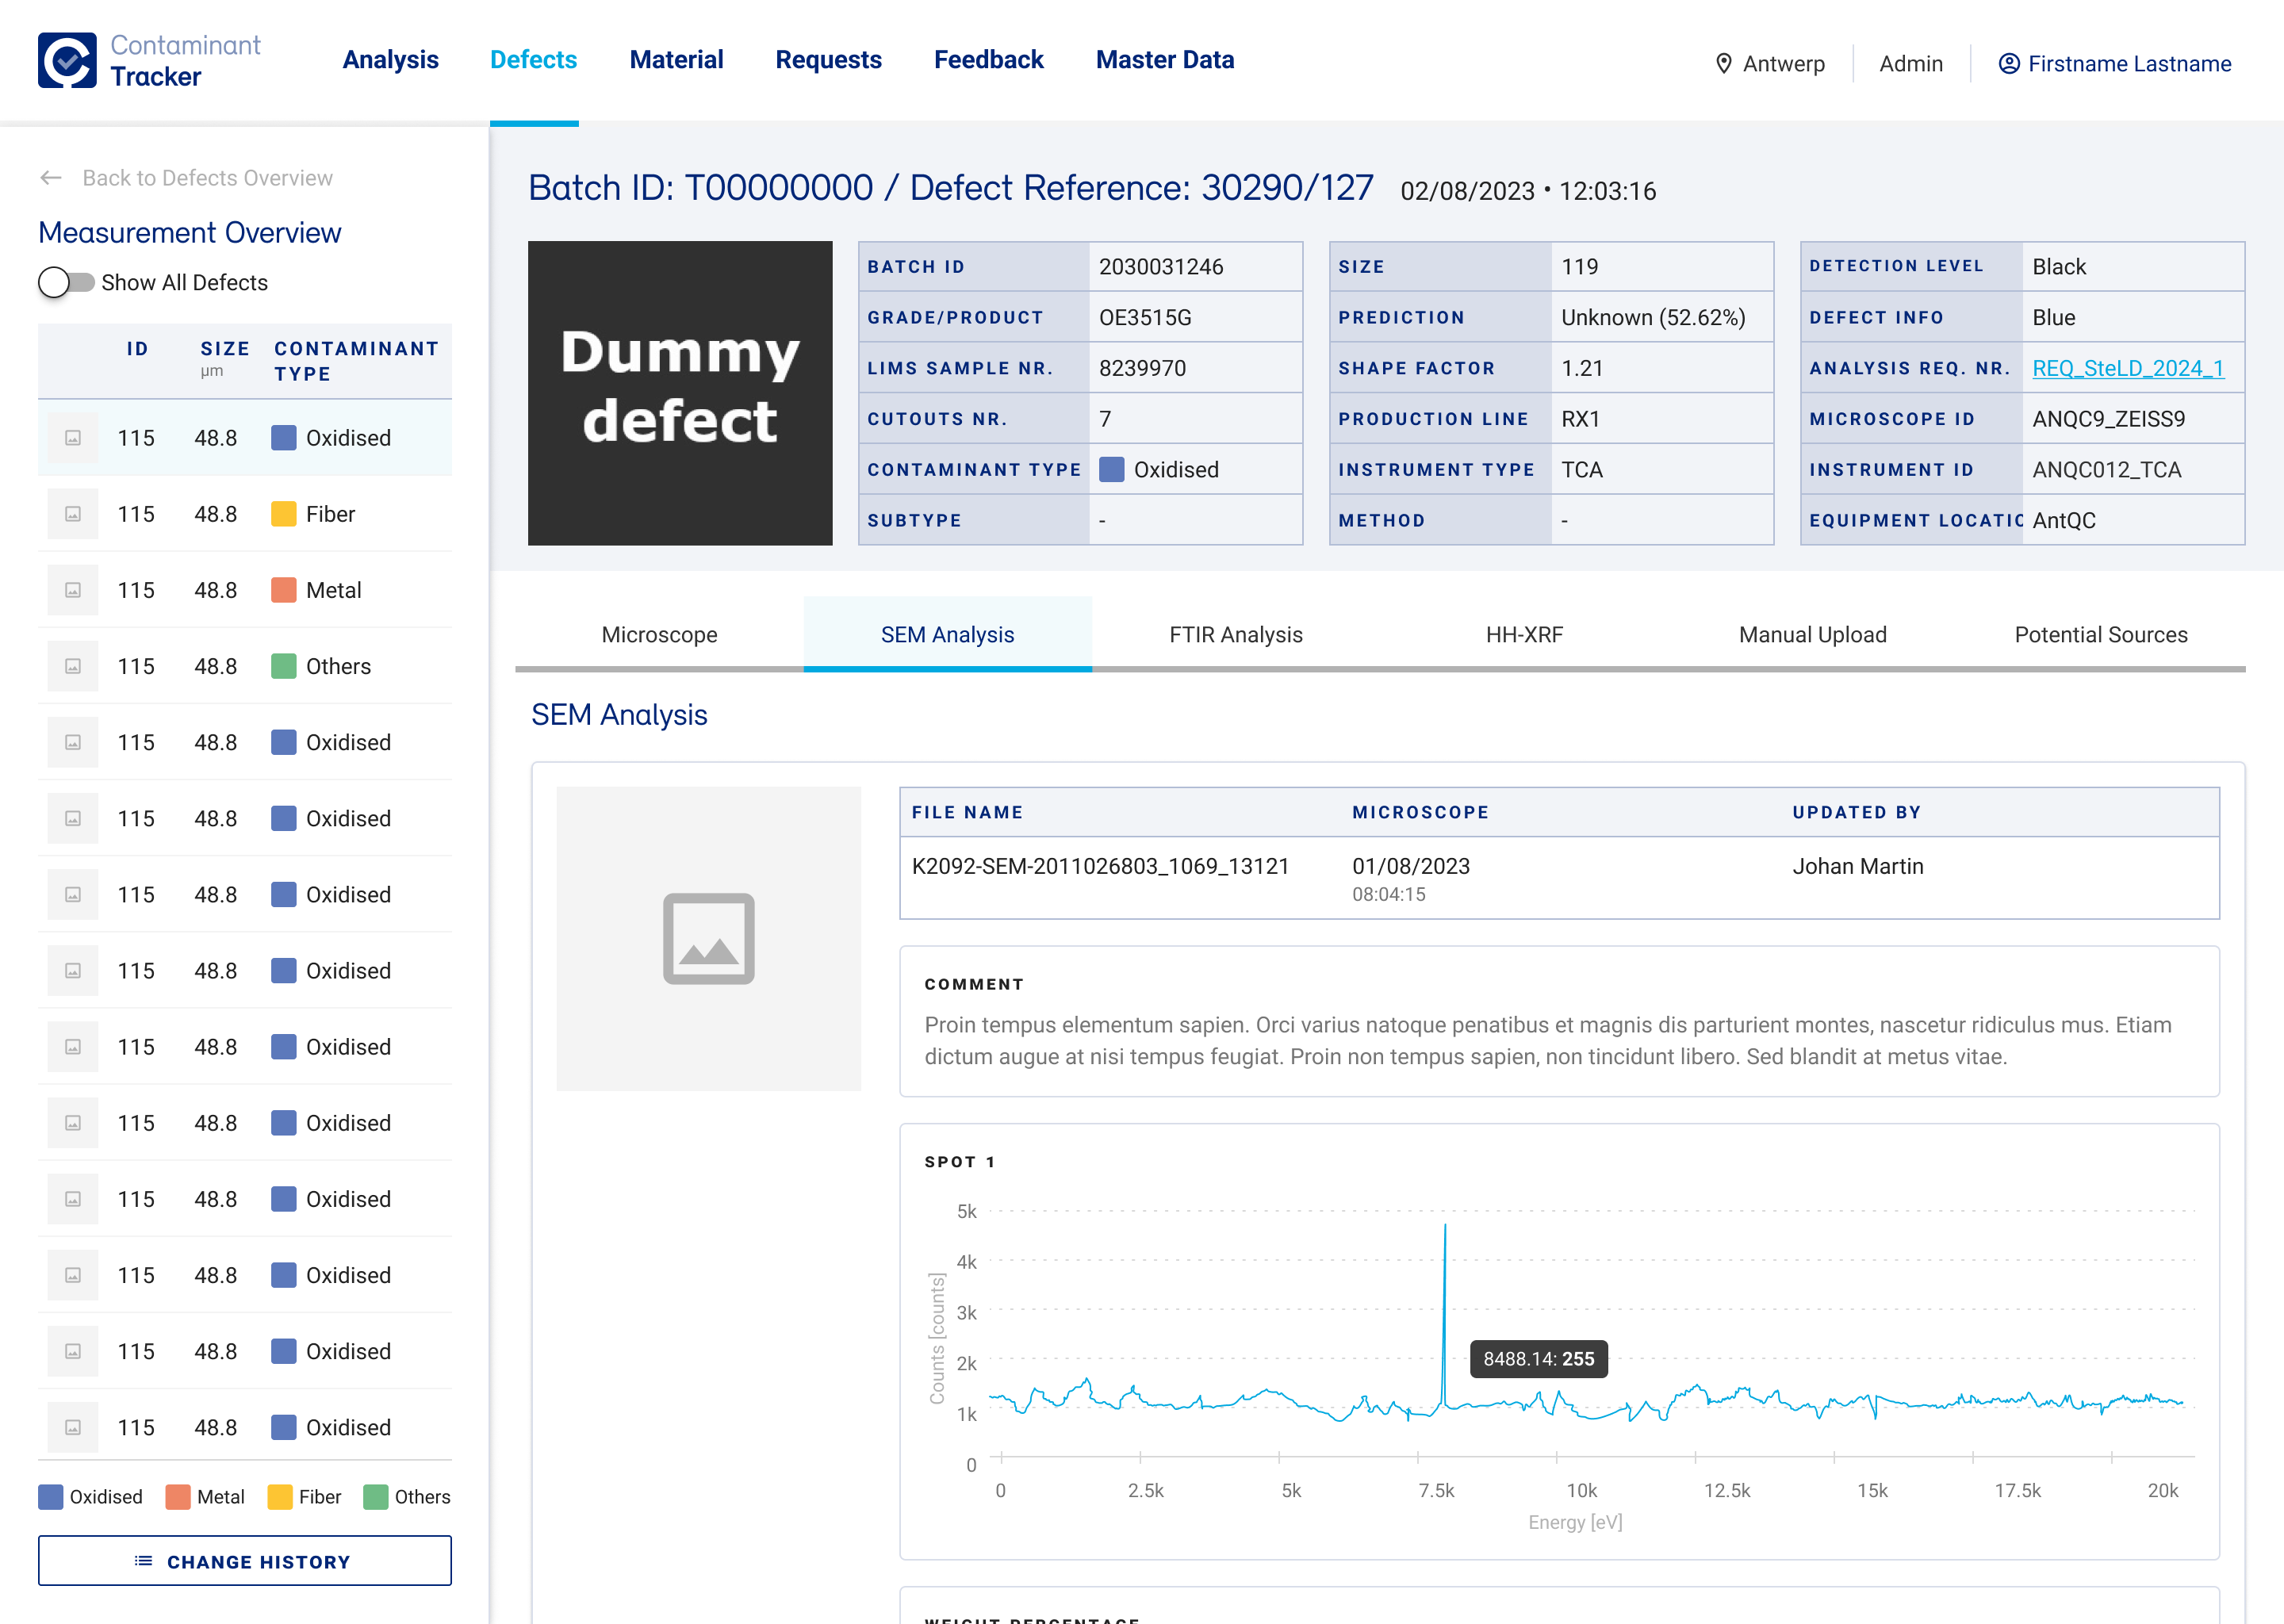
Defect Details - Measurement Overview
- Navigational aid.
- Moved the Measurement Overview which was placed as an Analysis tab creating a semantic mismatch.
- Added color-coded contaminant types to give clarity and enable rapid scanning.
- Tab navigation separates different analysis methods without overwhelming the user.
1
2
4
3
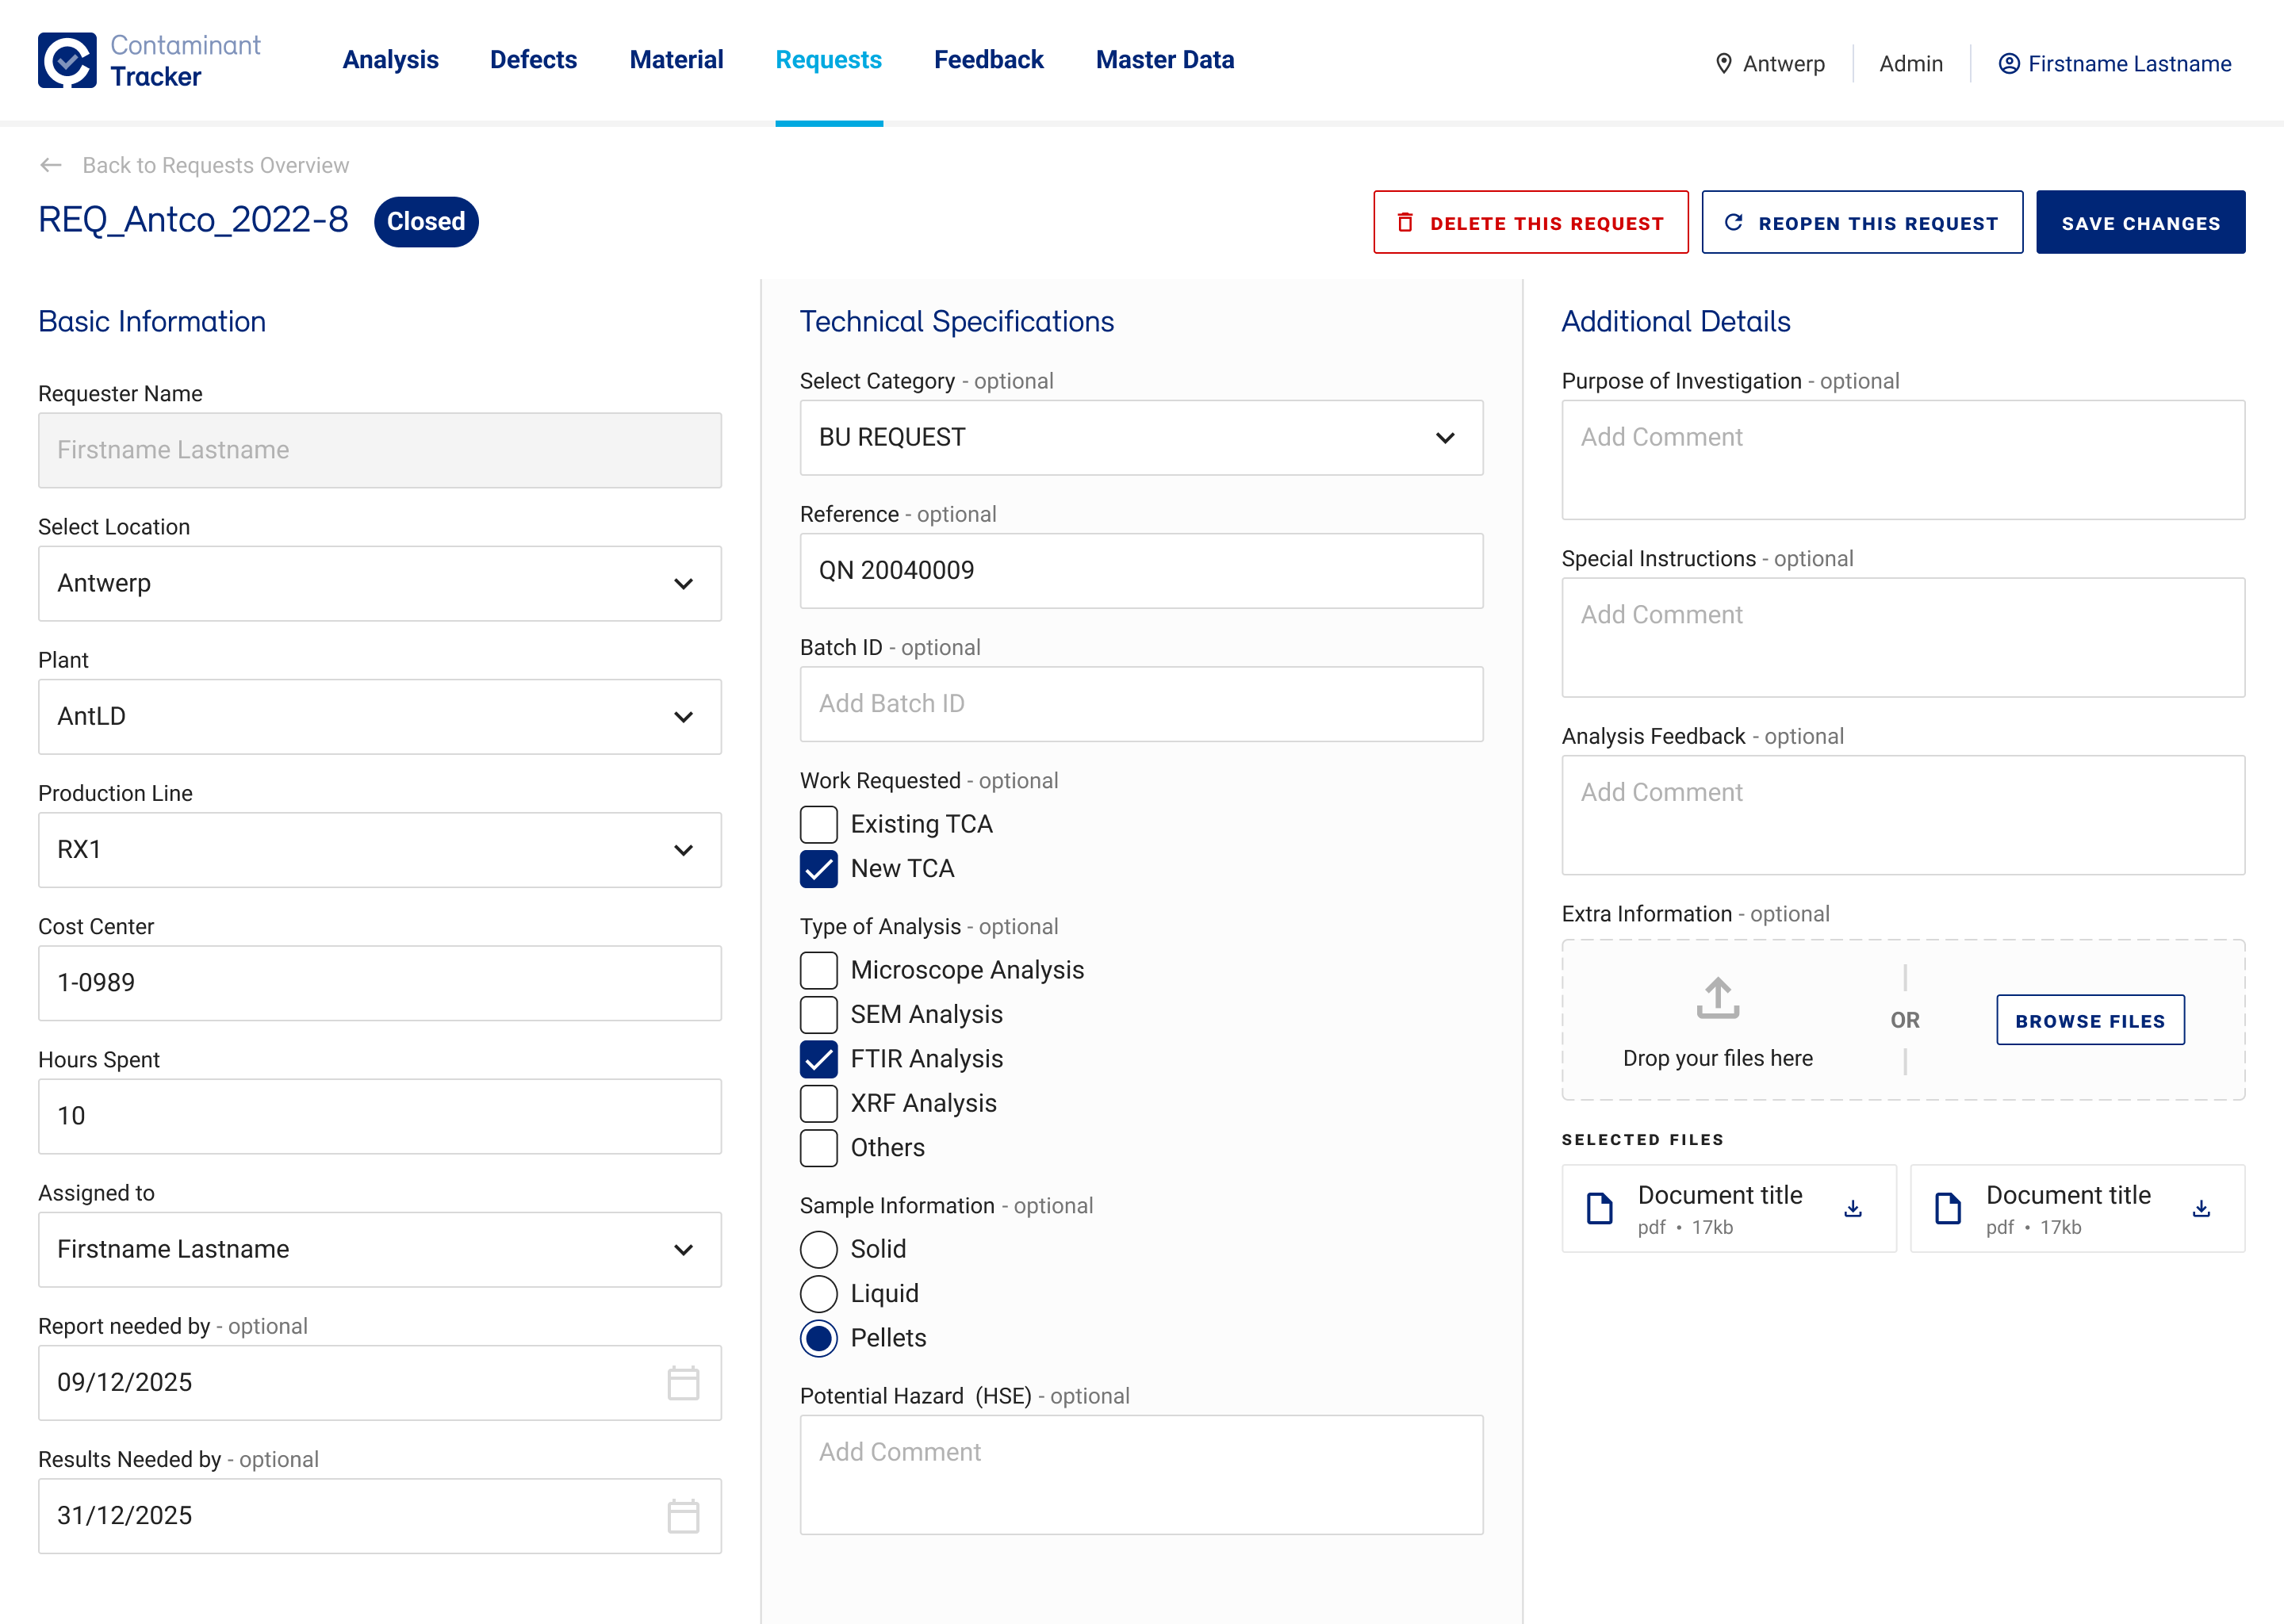
Edit Request
- Designed three-section layout to maximize space usage and allow users to see all relevant fields without scrolling.
- Used subtle but clear visual treatments to distinguish sections and grouping.
- Improved arrangement to group information in three-sections Basic Information, Technical Specifications and Additional Details.
1
2
3
Learnings
Simplification is not always possible
Quality Controllers needed a lot of data which cannot be hidden or removed. The solution wasn't reduction it was reorganization. I used visual hierarchy, logical grouping, and progressive disclosure, to present all relevant data without overwhelming users.
You need to understand data
We had to collaborate very closely with them to make sure we understood how data was interconnected. This meant learning not just what "LIMS Sample Nr" or "Production Line" meant in isolation, but how QCs used these to trace materials through the whole quality control pipeline. The logic that connected them informed how we structured forms, organized data groupings and designed navigation paths.
COPYRIGHT © 2025 KARLA MARTINEZ.
These works have been distributed to you on a confidential basis for your information only. By accepting it, you agree not to disclose them to any other person or entity in any way or use the information for any purpose other than to consider business opportunities with Karla Martinez.


Projects
Explorations
About Me


Contaminant Tracker
A custom-made tool for Quality Control Engineers to predict, analyse and label contaminants for products made at Borealis.
Product Design
Dashboard
R&D
The project
Borealis is one Europe’s biggest providers of polyolefins base chemicals. To maintain the quality of their products, Quality Controllers (QCs) use Contaminant Tracker daily to analyse chemical samples and report defects. As part of a software migration, Borealis wanted to revamp their platform experience to improve learnability, make it easier to use and reduce reporting errors.
My role
As a UX/UI Designer, I worked directly with Quality Control Engineers (QCs) to understand their workflow and major pain points with the old system. We created seven sections, which we tested and validated with QCs and other stakeholders (e.g. Product Owner).
Finally, I created a new component library to ensure visual consistency and worked closely with the development team to review its accurate implementation.
Challenges
Contaminant Tracker was a highly technical, data-intensive system. This means that, in many cases, we needed to find ways to make pages more readable, without removing content. Additionally, beyond understanding users’ pain points and processes, we needed to understand how items (and their data) were related to each other.
Analyses require numerous specifications which was overwhelming for users. Specially without the right visual hierarchy.
The tool used highly specialised language (e.g. SEM Analysis, LIMS, HH-XRF, TCA, cutouts)
There was a lack of visual guidance about steps to follow to complete a task.

Defects can be linked to several studies, and each study may fall into a different category with its own data structure. This made this section very confusing.


Understanding the problem and context
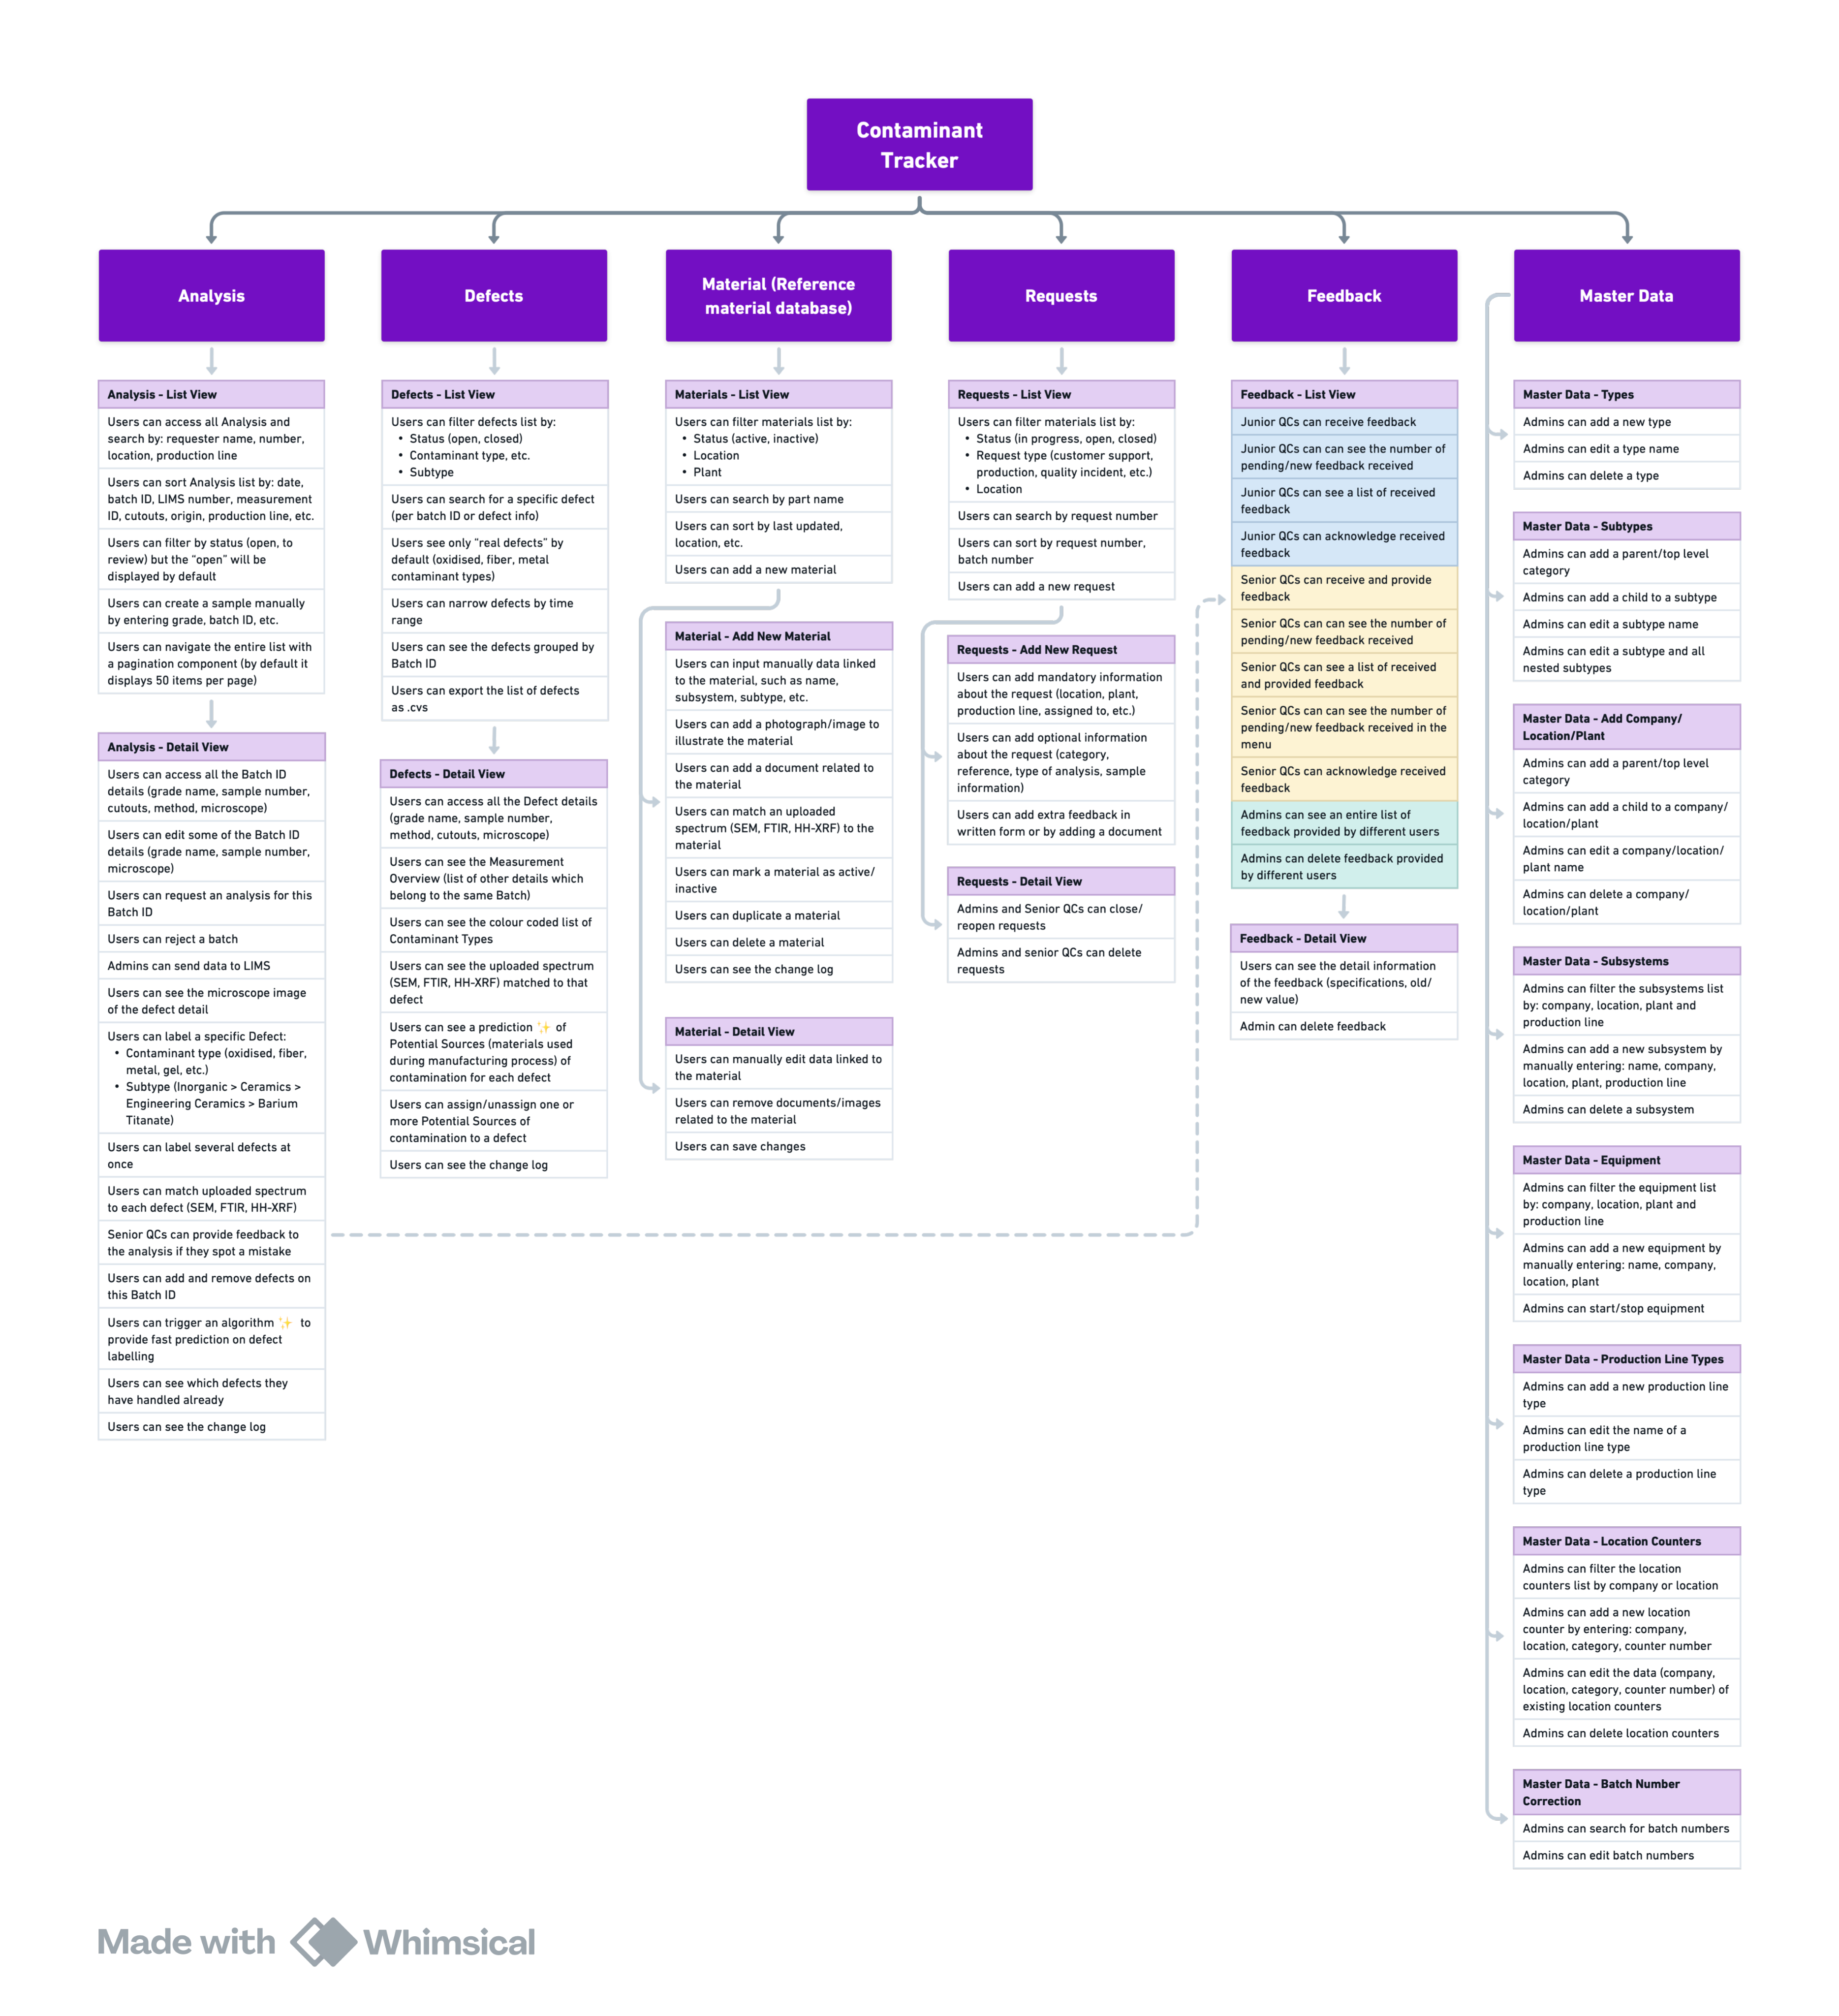
Contaminant Tracker’s Architecture
The platform consisted of 6 sections. The level of access depended on the type of user. We mapped the architecture of the site as it was originally and completed as we got more information through contextual inquires, requirement analysis and testing.
Information Architecture. View in Whimsical.
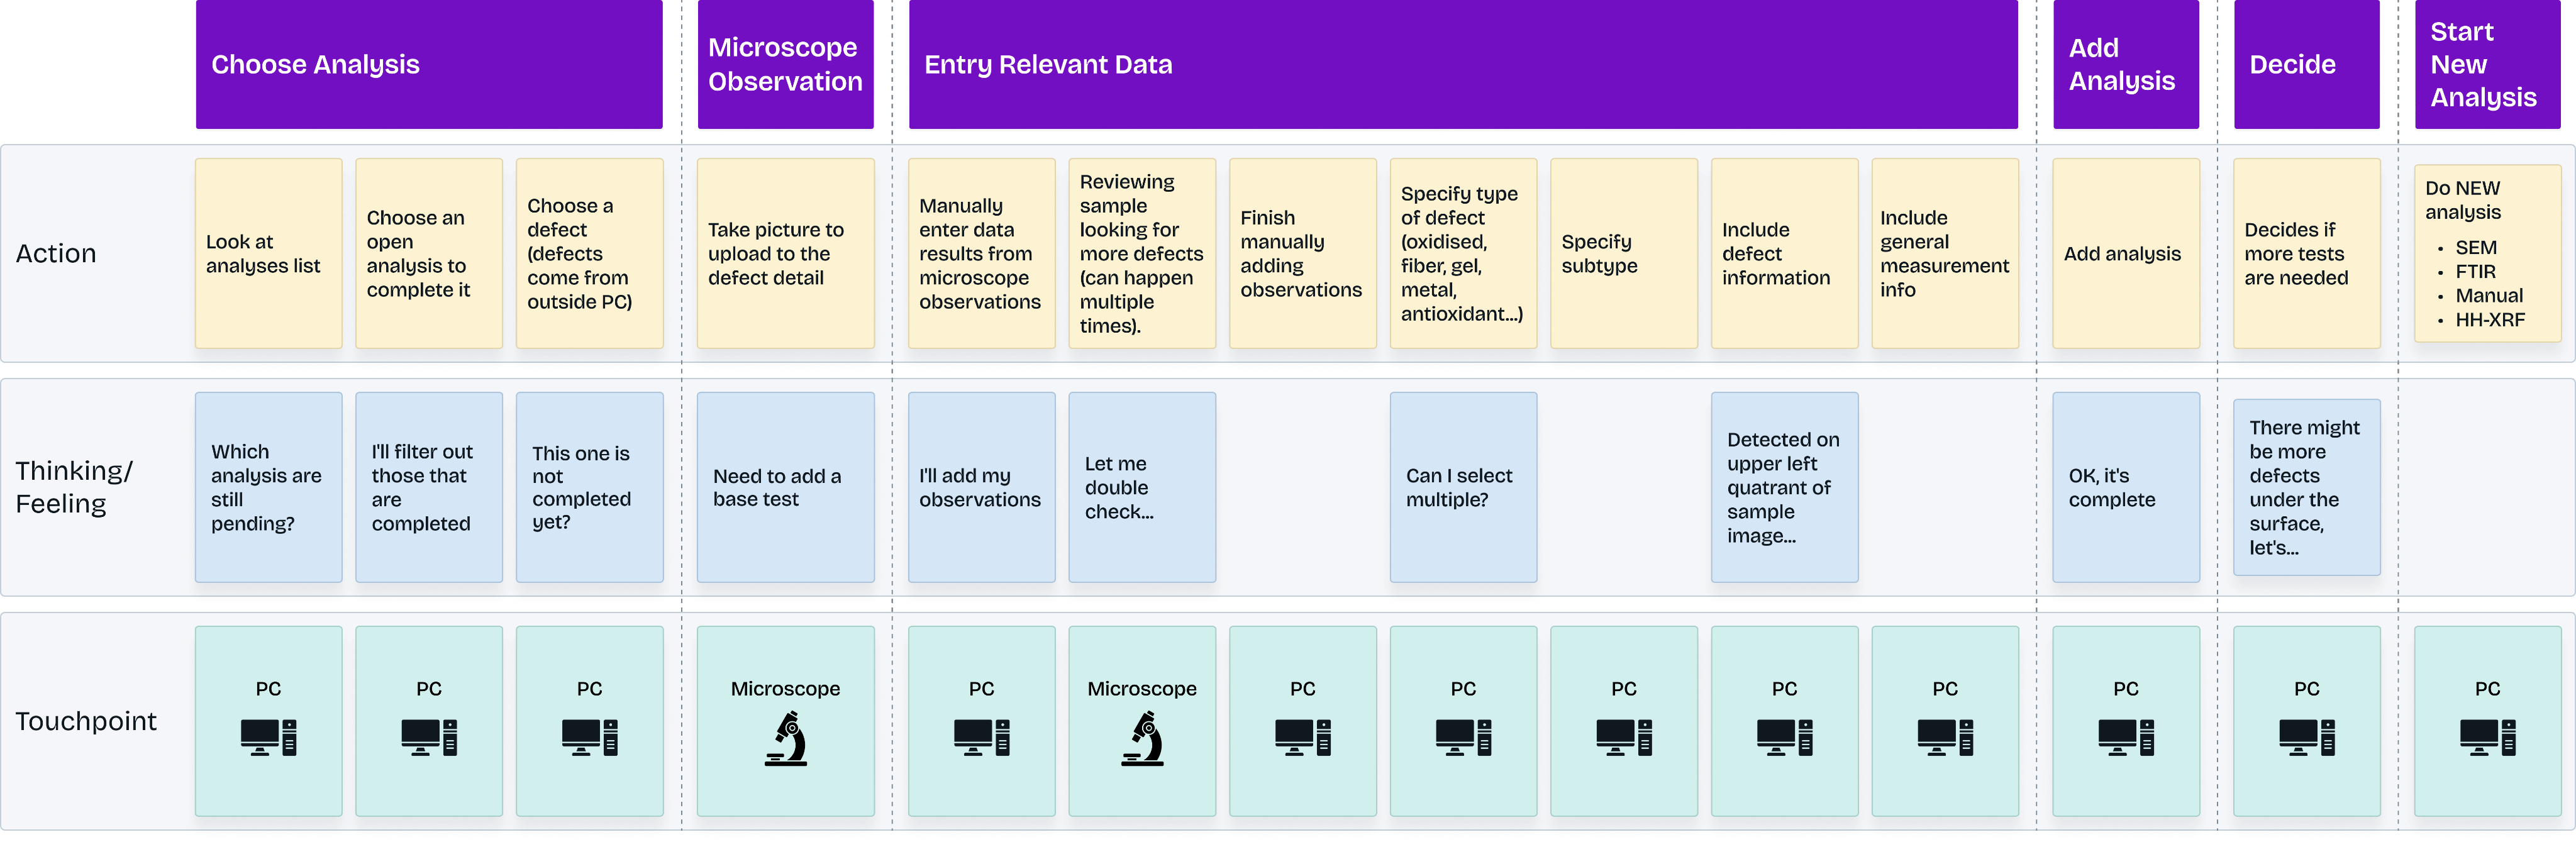
Customer Journey map
In some cases, QCs move between mediums (e.g. microscope, computer, access to remote equipment). We wanted to understand what users where trying to achieve throughout their whole workflow, where they were confused or unsure. We did journey maps for different experiences, like reviewing defects, materials, making requests, etc…
Customer Journey Map. View in Whimsical.
Heuristic Evaluation and Contextual Inquiries
I conducted a heuristic evaluation of the site to identify issues such as items with unclear states, or cases were users cannot recover from an error.
Some findings included:
Visibility of system status and recognition:
Across the platform, multiple labels were not self explanatory. Users had to review documentation or memorise meaning.
Error prevention:
Forms allowed to freely input values where only predefined options should be selected.
Recognition rather than recall:
In many cases, the interactions between UI components were unclear. For instance, how a checkbox changed a button’s action.
After that, I conducted Contextual Inquiries with QCs to observe how they went about reporting analyses results.
Inaccessible items:
QCs frequently use the system solely with their keyboard as they use one hand to operate their computer and the other one to manipulate a microscope. However, not every section was reachable using the tab button and the lack of order meant that “tab” navigation was inconsistent.
Hidden buttons:
Some buttons were almost hidden and their functionality unclear.
Information Sequence:
The order in which information was presented in tables, did not match how users read and filtered data.
Business needs (and requests)
Initial requirements were provided by the Product Owner, but required further definition from a UX perspective. I translated these needs into concrete UX behaviors and visual components, and by determining how to integrate them into the interface without increasing cognitive load.
As a QC, I want data input to match the output from SEM/XRF so I know how to properly entry the data
As a QC, I want to add new HH-XRF analyses to a batch so I can complete a report
As an admin, I wan to be able to re-open requests that I deemed incomplete so QCs can work on them again.
Wireframes and Testing
We had frequent contact with QCs- That allowed us to ran tests whenever we did major changes to the system’s navigation or how data was presented. We alternated between junior and senior QCs to complete tasks they already did in the legacy system but using the revamped version.
Sample Task:
Your supervisor has confirmed that they recently did a study with a Microscope J2001. This study is related to the Batch ID REQ_SteCO_2025_2.
Assign the study with the appropiate information to the correct Batch ID.
Revamped Designs
Here are some details on the what and why of some of the changes we did.
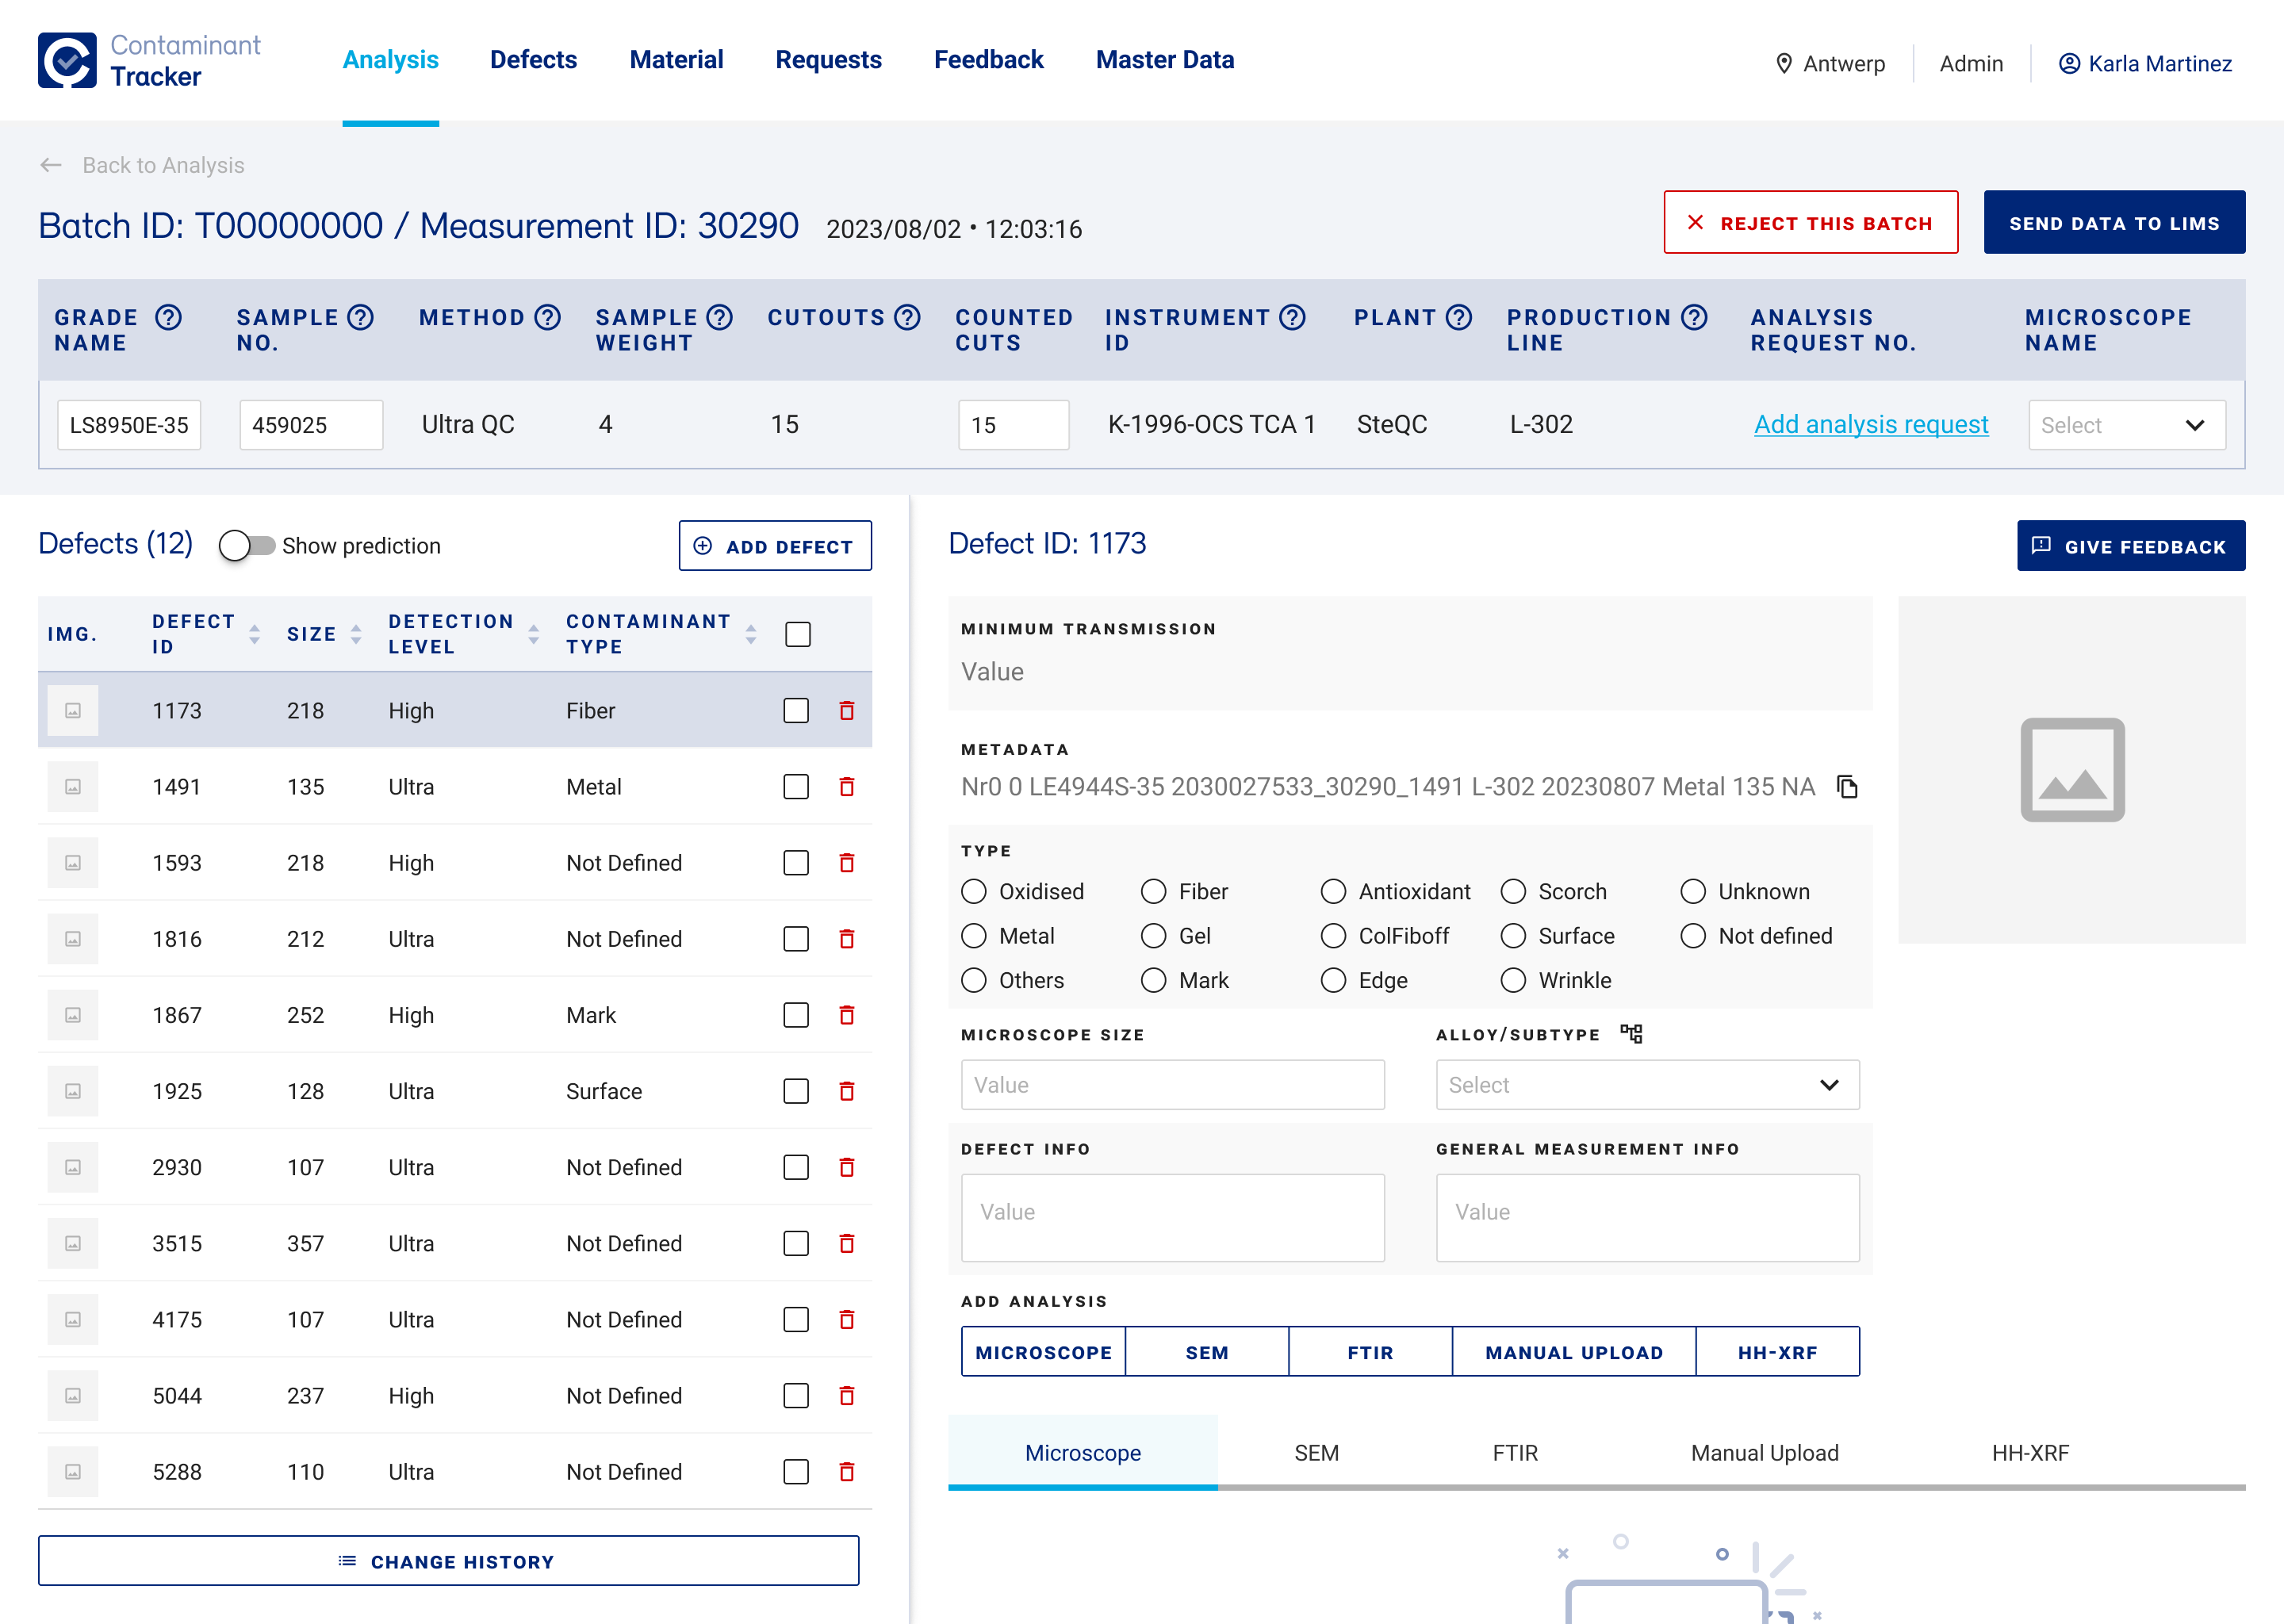
Batch Detailed View
- Explicit copy: Added labels, changed language and visual treatment to make clear what components do.
- In-context help: Tooltips for technical concepts to reduce the time QCs, specially new ones, spend reviewing documentation.
- Easy to follow layout: Re-designed the screen layout to clearly distinguish between UI areas (Batch ID Details, Defects List, Defect Details), and clarify the steps to follow to complete a task and improve navigation.
- Progressive disclosure: Added navigation tabs for advanced features (such as ”Add SEM analysis") to be showed only as the user needs them, to improve usability and reduce cognitive load.
1
2
4
3
3
3
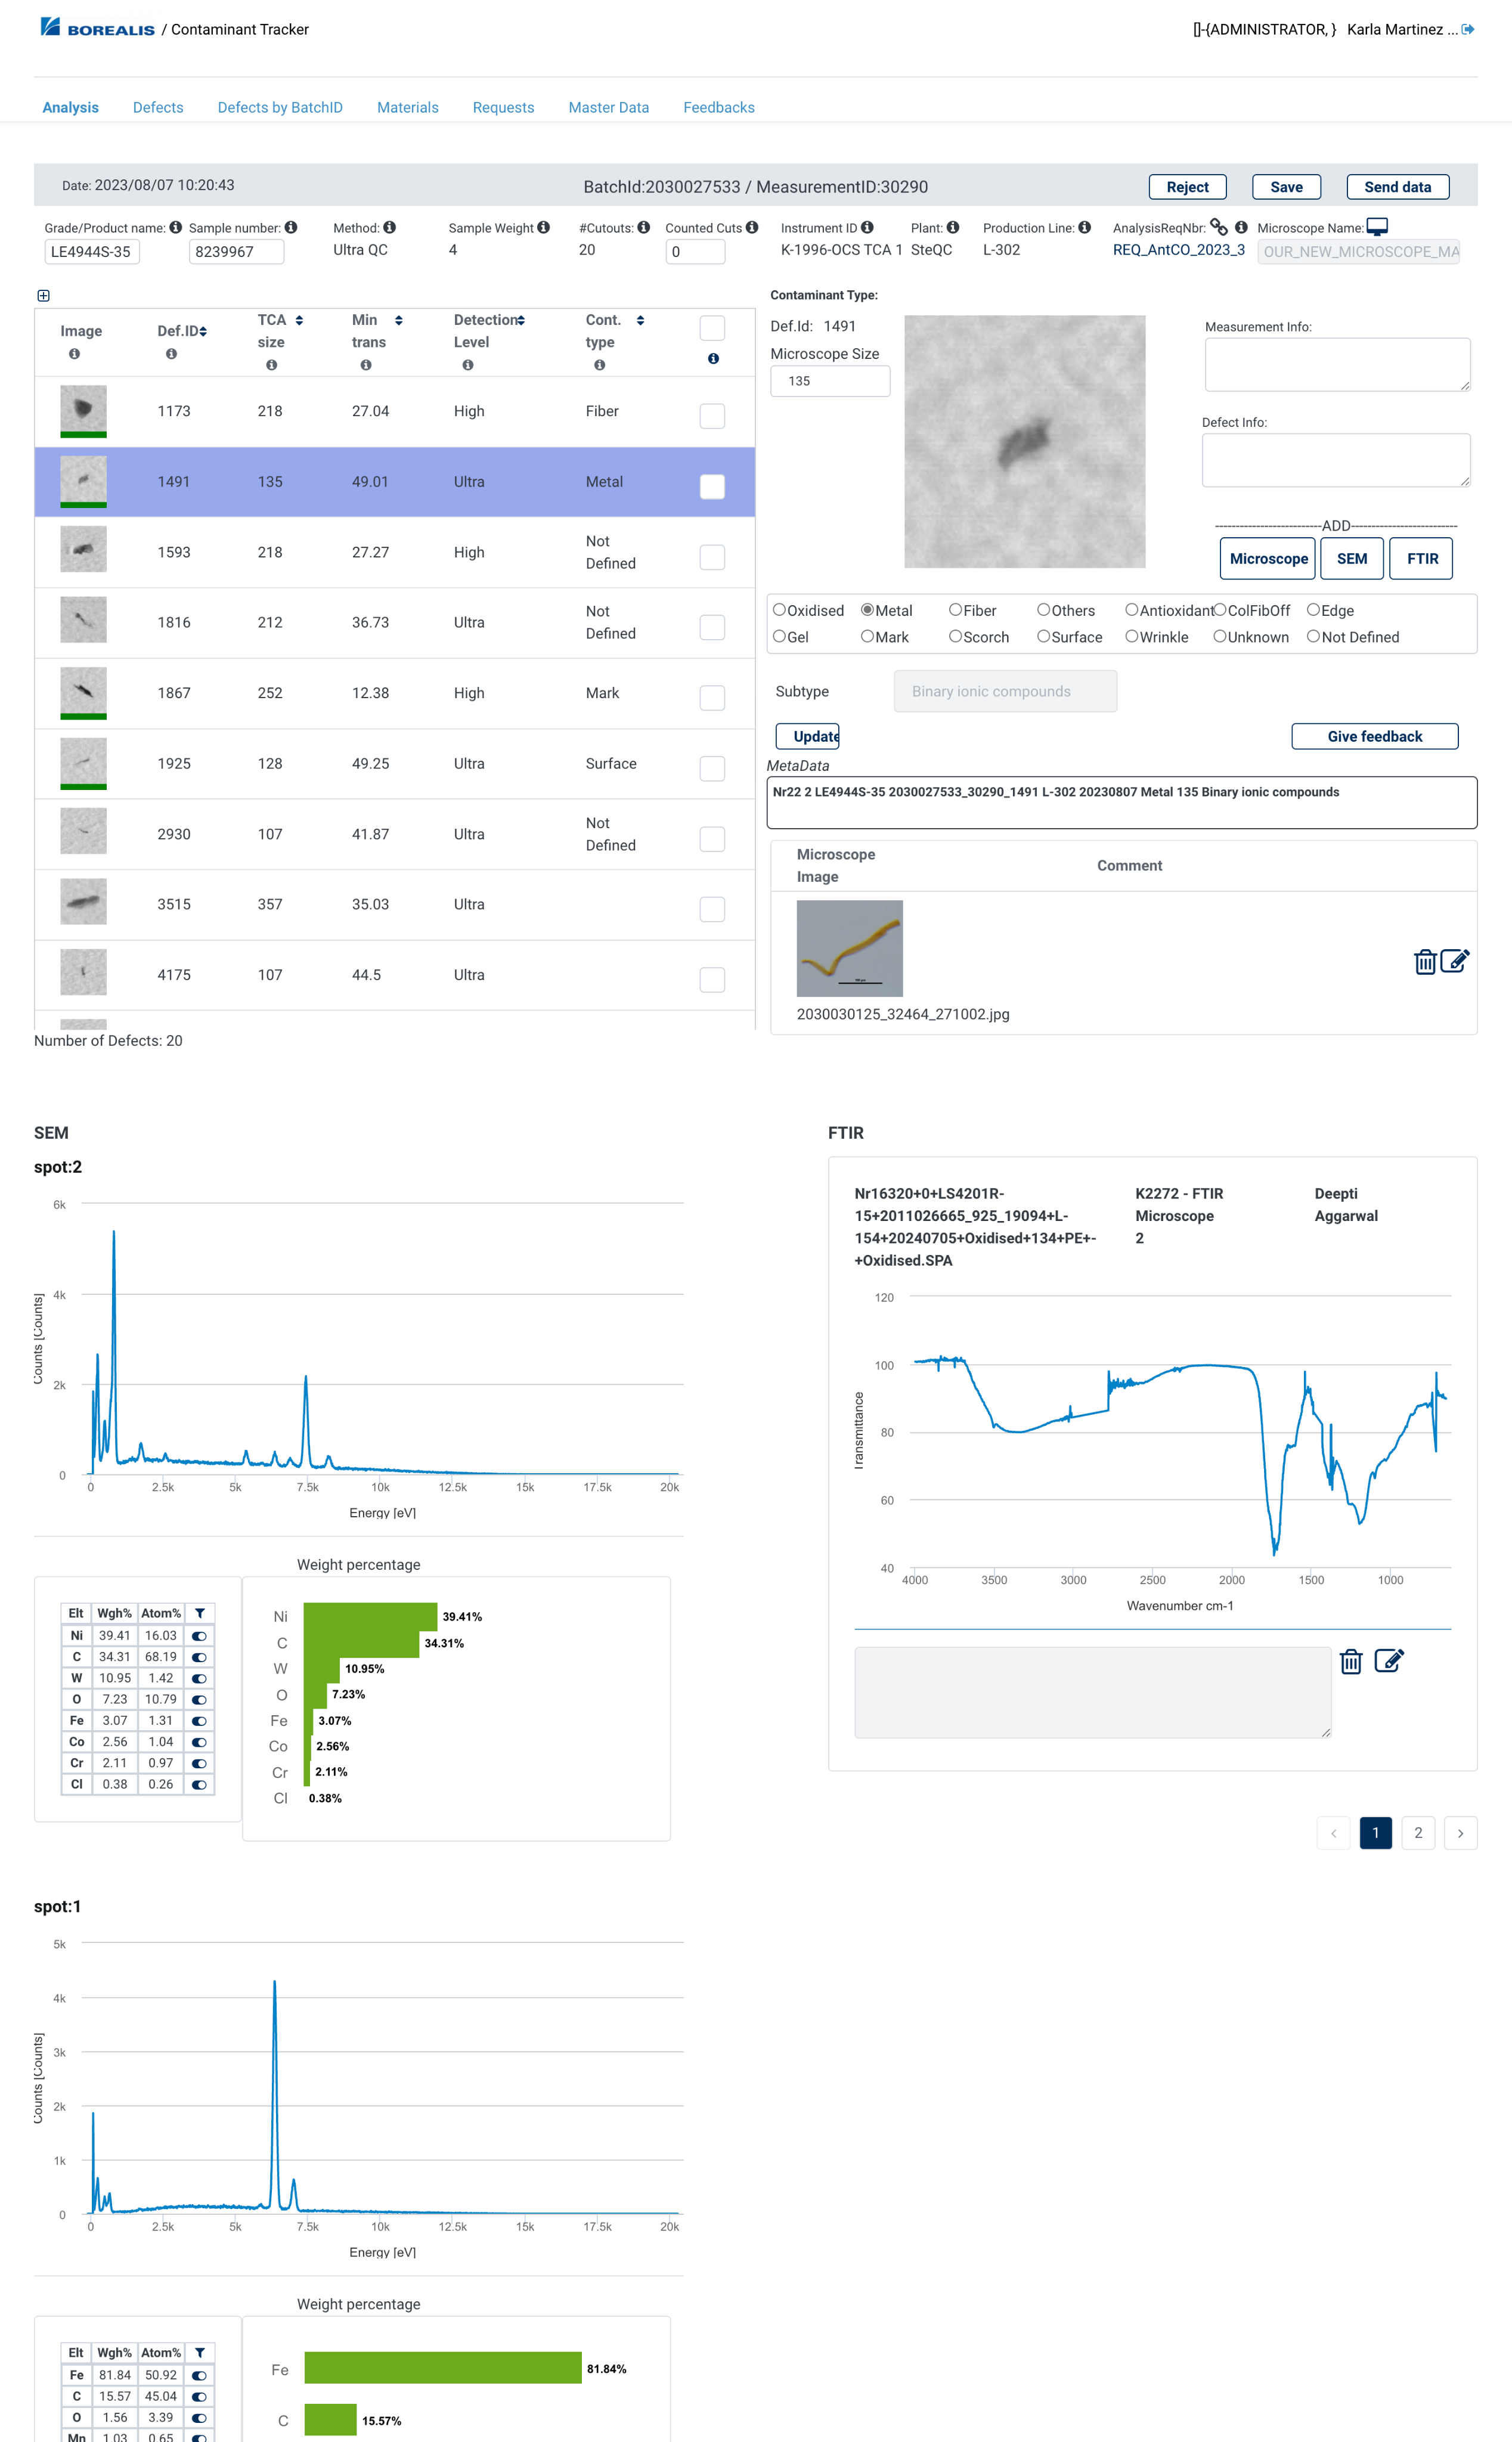
Defect Details - Measurement Overview
- Navigational aid.
- Moved the Measurement Overview which was placed as an Analysis tab creating a semantic mismatch.
- Added color-coded contaminant types to give clarity and enable rapid scanning.
- Tab navigation separates different analysis methods without overwhelming the user.
1
2
4
3
Edit Request
- Designed three-section layout to maximize space usage and allow users to see all relevant fields without scrolling.
- Used subtle but clear visual treatments to distinguish sections and grouping.
- Improved arrangement to group information in three-sections Basic Information, Technical Specifications and Additional Details.
1
2
3
Learnings
Simplification is not always possible
Quality Controllers needed a lot of data which cannot be hidden or removed. The solution wasn't reduction it was reorganization. I used visual hierarchy, logical grouping, and progressive disclosure, to present all relevant data without overwhelming users.
You need to understand data
We had to collaborate very closely with them to make sure we understood how data was interconnected. This meant learning not just what "LIMS Sample Nr" or "Production Line" meant in isolation, but how QCs used these to trace materials through the whole quality control pipeline. The logic that connected them informed how we structured forms, organized data groupings and designed navigation paths.
←
Back to Projects
Next Project
→
COPYRIGHT © 2025 KARLA MARTINEZ.
These works have been distributed to you on a confidential basis for your information only. By accepting it, you agree not to disclose them to any other person or entity in any way or use the information for any purpose other than to consider business opportunities with Karla Martinez.